
Flowcharts For Developers With Mermaid js
One of the most important soft skills we can have as developers is being able to communicate how our code works. Other developers can dive into your code to see how it works, but this can be time-consuming, and your stakeholders most likely won’t be able to. What we need is some way to communicate the logic of our code in a standard way so anyone else can understand it quickly. Flowcharts are one way that we can communicate this and more.
In this article, we’ll discuss what flowcharts are, some important flowchart symbols, and how to generate them so that by the end of the video, you’ll be able to use them to communicate your next awesome idea.
What are Flowcharts?
At a very basic level, flowcharts are graphical representations of algorithms or processes. They use standardized symbols to depict different elements and the flow of control.
As developers, we’ll use them to describe how our algorithms work, but they can also be used to describe how processes like troubleshooting steps or even an onboarding process for a new employee.
Why Use Flowcharts?
Flowcharts provide several benefits. First, they help us analyze and identify potential issues or inefficiencies in our code before we even start writing it. Secondly, they assist in designing complex algorithms by breaking them down into smaller, manageable steps. Lastly, flowcharts make it easier to collaborate with other developers and stakeholders, as they provide a clear visual representation of the logic.
Common Flowchart Symbols and Their Uses
Let’s take a look at some of the more common flowchart symbols and how we’ll use them.
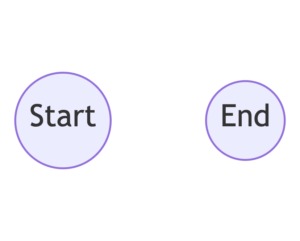
Start/End Symbol
The first element we’ll discuss is the Start and End symbols. This is used to indict the beginning or end of a flowchart or process. It’s represented using an oval.
Arrows/Lines
To connect all our elements, we’ll going to use arrows. The arrows will indicate the direction of travel in the flow chart, and ideally, the lines won’t cross to keep it as easy to read as possible.
![]()
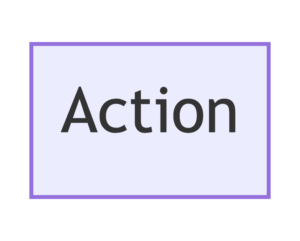
Actions
To describe actions or operations we’ll use a rectangle symbol. This might be collecting data from a file, building an object, or performing some action on our data.
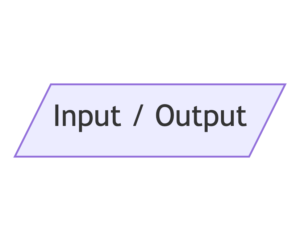
Input/Output
The input and output phases of the flow chart are represented using a parallelogram.
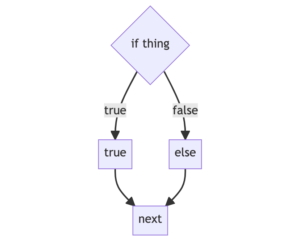
Decisions
Decisions are one of the most important things we’ll need in our flowchart. We’ll use a diamond shape to represent decision points in our flowchart. As developers, we’ll use these all the time to describe common flow statements.
For example, this is an if/else block.
And this is a loop.
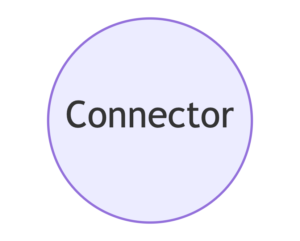
Connector Symbol
The final symbol we’ll discuss today is the connector symbol which is used to connect different parts of the flowchart that are located on separate pages or sections. Connection Symbols are circles.
Creating Flowcharts
Let’s go over some best practices for creating effective flowcharts.
The first thing is to keep it simple. The goal is to communicate a process, so we want to make sure we use clear and concise symbols and avoid unnecessary complexity. Include comments to better improve understanding of the flowchart.
Make sure you use appropriate connectors and symbols. By using random symbols it makes it harder for others to read the diagram when they need it. As always, there’s already a standard, so we should learn it and use it.
Finally, make sure you validate and test your flowchart by testing it against real-world scenarios. Nothing is worse than having a wrong flowchart.
Flowcharts themselves provide no requirement for how we generate them, so we have a lot of options.
At the lowest level of technology, we can create our flowcharts using pen and paper or a whiteboard. Whiteboards are an excellent option if you’re brainstorming with a group of people, and pen and paper are great for quickly working something out. Both of them suffer from the fact that it’s hard to change our flow charts as we come up with modifications, so they can get messy.
The next level up is to use a program to draw the flow charts. We can use word processing tools to generate basic flowcharts, and there are even programs like Visio, Lucidchart, and diagrams.net that are specific for drawing diagrams. Again these are awesome tools for people to use, but they still suffer from some drawbacks. The biggest is that the files that these programs generate can be a challenge to manage using source control and tend to take a fair amount of effort to add and remove steps to make them look nice. If you’ve ever inserted an image into a Word document you might know how it can quickly destroy the formatting on the rest of your document.
If you couldn’t tell yet, I have another solution. And that’s to use a tool to generate the flowcharts from some kind of text document. That would provide us with an easy way to define what our flowchart will look like without having to worry about laying it out, and we can easily include it as part of our source control as it uses plain text to define the file. We can even embed it into other documents that support it.
We’ll discuss that solution after this word from our sponsor.
Creating Flow Charts Using Mermaid Syntax
The solution to all of our problems from before comes in the form of the syntax created by the Mermaid.js project. Mermaid.js provides a command line tool that we can use to convert a text file containing Markdown-inspired text into all kinds of diagrams.
Check out their documentation for a full list of supported diagram types. A few that are important to us as developers are, of course, Flowcharts, but there are also sequence diagrams, flow diagrams, and state diagrams. State Diagrams are another thing you should look into, as they’re a powerful way to represent finite-state machines.
If you want to try mermaid.js before installing it or you want to let a non-developer try it they can do so using https://mermaid.live/. It’s a powerful online tool that allows you to type the diagram out and see the results as you’re trying.
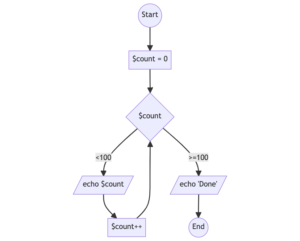
Let’s get into our example; we’re going to create a very basic flow chart that describes a function that uses echos to output all numbers from 0 to 99 and then echos “Done”.
To start, we’re going to write the word flowchart to indicate we’re creating a flowchart. Then we need to include either TD or LR to indicate we want the flowchart drawn in the top down or left to right orientation, respectively.
For this example, we’ll use TD to make it a little easier to read.
flowchart TD
Now we need to create the Start Symbol to indicate where we start the flow chart. In mermaid.js we do this by defining a node using the name that we want to reference the node by and the text we want to have on the symbol enclosed by how we want to render the node. We can name the node using one or more characters. I like using single characters for most flowcharts, and when the flowchart gets complicated enough that you’re having trouble tracking all the nodes using single characters it might be time to break it into multiple flowcharts.
Start/End symbols use double parenthesis to enclose the text so we can write S((Start)) to generate a “Start” node.
flowchart TD
    S((Start))
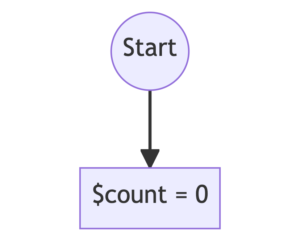
Now we need to add our next step, which is just to set $count = 0. We’re going to use square brackets “[]” to indicate that the node is an action.
flowchart TD
    S((Start))
    A[$count = 0]
To link these two nodes together we’re going to use --> to define where the arrows should be placed. We have two options for how to do this. We can either create the definition on a new line.
flowchart TD
    S((Start))
    A[$count = 0]
    S --> A
Or, we can combine the node definitions we currently have with the line.
flowchart TD
    S((Start)) --> A[$count = 0]
I like the second option because it reduces the line count, and it’s a little easier to read because we can see the definition and where it’s going at the same time. The first option will do better in source control, so that’s what I use day to day.
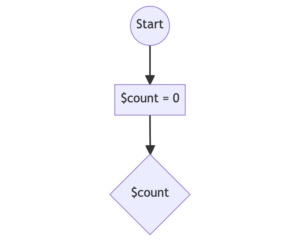
Now we need need to add the decision that will determine if we’re still in the loop. Decisions are defined using the curly braces “{}” and then we’ll put the statement we’re testing in the curly braces.
flowchart TD
    S((Start)) --> A[$count = 0] --> B{$count}
To define the inside of the loop we need to define under what values of $count we want to run the loop. This is done by using pipe symbols “|” like so B -->|<100| C[/echo $count/]. Then we can finish up the remainder of the inside of the loop, which includes incrementing the count and then returning to the decision diamond.
flowchart TD
    S((Start)) --> A[$count = 0] --> B{$count}
    B -->|<100| C[/echo $count/] --> D[$count++] --> B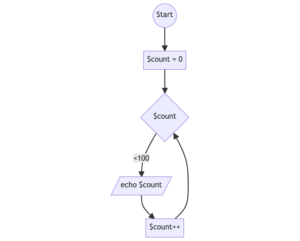
To finish this we’ll define what happens when the loop is done and go to a terminating node.
flowchart TD
    S((Start)) --> A[$count = 0] --> B{$count}
    B -->|<100| C[/echo $count/] --> D[$count++] --> B
    B -->|>=100| E[/echo 'Done'/] --> F((End))
Now you know the basics to create flow charts in mermaid.js so you can continue to communicate effectively with your team.
Other Places We Can Create Flow Charts
So the cool thing about knowing mermaid.js syntax is that it can be used in all kinds of places. Github has support for it in its markdown, so you can add a mermaid flowchart to any PR or comment by starting a code block using three backticks and then the word mermaid.

It’s very strict in its formatting, so you might have to play around with it before it will work.
PHP Storm also has a plug-in that allows us to type mermaid syntax and see the output in real time. We can even do it in a scratch file.
What You Need To Know
- Flowcharts are an amazing way to communicate algorithms or processes graphically
- It can be drawn by hand, drawn using a program, or generated dynamically
- We can use the mermaid.js syntax to generate them all over the place


Leave a comment
Use the form below to leave a comment: