
Creating RRD graphs in PHP
 You may not be familiar with the term RRD graph, but if I show you one, you probably recognize them instantaneously. They are used to plot all kind of data against time in a very easy way which is why they are used a lot in all kind of applications. Even though many consider RRD as a library to create graphs, it is actually more than that: it’s a complete system to store aggregated data in a very efficient way.
What is RRD?
RRD stands for Round Robin Database. It is a database for collecting all kinds of data against time. The “round robin” stands for the fact that only a certain amount of “data points” can be stored. When we reach the end of the database, it will wrap back to the begin again. This means that RRD database files will never grow in size.
Every RRD works with a “step rate”, which tells us how far the data points are located from each other. Normally this is 300 seconds (5 minutes) so all data is stored in a 5 minute interval. This doesn’t mean you only can add data every 5 minutes though. You can add as much data into the RRD and at any time you like. The RRD will combine this data into a data point. If you have a default step rate of 5 minutes but you add some data every minute to your RRD, it will average these 5 values into 1 data point. As you can image, RRD’s are not really for storing actual data, but just for graphical and statistical usages.
Getting the extension
Before we can do something useful with RRD, we need to install the RRD extension. If you are running on CentOS you are in luck. The RPMForge repository provides a php5-rrdtool package which you can install with “yum install php5-rrdtool”. On a Debian or Ubuntu system there is no default package but it’s very easy to build from the source.
If you cannot build the extension or you cannot find anything working, no fear. You can still use the command line version of RRDTool to try all examples.
Our RRD example
The best way to get acquainted with RRD is to actually create one. Suppose you want to display some statistics of users that have logged into our web-application and we want to see the number of failures that have occurred, for instance, when a user has entered a wrong password. We want to view this data in a daily graph, a weekly graph, a monthly graph and maybe a yearly graph as well.
Creating our database file
As said, RRDtool is more or less a “database” so we much define some kind of “schema”. In order to do this, we can use the “rrd_create” function (or the “rrdtool create” command line version). There are two different things we need to configure: the data sources and the round robin archives. The data sources tells you what to store whereas the round robin archives tells you how to store it.
Setting up data sources
The data sources describe the actual data we want to store. In our case we want to store 2 kind of data points: the number of succeeded log-ins, and the number of failed log-ins. We call them “success” and “failed” respectively. These data sources are “ABSOLUTE” types, which means the data is reset after every point collection. There are other types, depending on the type of data you want to store.
Furthermore, we need to specify a “heartbeat”. This means that when no data source is recorded in this amount of time, RRD will consider the data point as “unknown” (which is something different than 0!).
The last 2 items we have to specify is the lower and upper boundary of the data source. If we would have data source that is given in percentages (for instance, your server’s used disk space in percentage), we could specify an lower limit of 0, and an upper limit of 100. Since we deal with log-in attempts, we can only specify the lower boundaries. We set the upper boundary to ‘U’ (unknown).
Setting up the RRA
Now that we know WHAT to store, we must tell RRD how to store the data. As said, data is stored in a cyclic (round robin) way so we must define the amount of room we want to use. We want to have 4 different graphs: daily, weekly, monthly and yearly. This however does not mean we need to have 4 RRA’s. RRD can decide which RRA’s it will use to graph data.
Each RRA is defined in the following format:
RRA:cf:xff:steps:rows
The “cf” stands for “consolidation function” and can be either AVERAGE, LAST, MIN, MAX. It defines how the data points get aggregated. AVERAGE will average the points, LAST will store the last point, MIN will store the lowest point found and MAX the highest. The xff should be set to 0.5, and “steps” decide how many points get consolidated, “rows” is the amount of points it will store eventually.
I’ve decided to create 3 RRA’s: one stores the single 5-minute samples for a period of 1 day (12 points per hour times 24 hours = 288 points), one stores 1 hour samples (12 points) for 1 week (24 * 7 points) and one stores 1 day (288 points) samples for a year (365 points).
Off course, we could have stored each 5-minute point for a period of 1 year, but we would have to store 12 * 24 * 365 = 105120 points! By storing in a consolidated way, we have an efficient way of storing the data while we still maintain enough information for plotting our graphs.
<?php

$options = array(
 "--step", "300",            // Use a step-size of 5 minutes
 "--start", "-6 months",     // this rrd started 6 months ago
 "DS:success:ABSOLUTE:600:0:U",
 "DS:failure:ABSOLUTE:600:0:U",
 "RRA:AVERAGE:0.5:1:288",
 "RRA:AVERAGE:0.5:12:168",
 "RRA:AVERAGE:0.5:228:365",
 );

$ret = rrd_create("login.rrd", $options, count($options));
if (! $ret) {
 echo "<b>Creation error: </b>".rrd_error()."\n";
}

?>
Updating your data
RRD must collect data on fixed intervals. We should have a separate system like a cronjob that collects the amount of data and updates the RRD accordingly. If we don’t update on time (as specified by the heartbeat), we get unknown points (which causes empty spots in our graphs later on). The next snippet will “simulate” login successes and failures ranging back from 180 days ago until now:
<?php
  // Fetch current time
  $now = time();

  // Simulate last 180 days of login, with a step of 5 minutes
  for ($t=$now - (3600 * 24 * 180); $t<=$now; $t+=300) {
    $success = rand(0, 10);
    $failure = rand(0, 5);
    $ret = rrd_update("login.rrd", "$t:$success:$failure");
  }
?>
Graphing
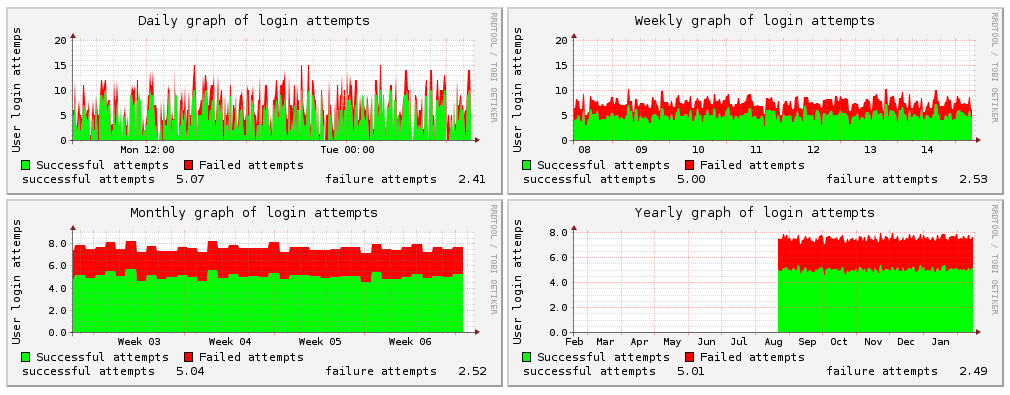
Now we have arrived at the coolest part of RRD: the graphing of the data. I create 4 basic graphs. Each graph shows the successful attempts in green, and on top I’ve specified the failed attempts. There are many different ways of graphing the data (as lines, different shades, surfaces etc) and almost every aspect of the graph is customizable.
<?php

create_graph("login-hour.gif", "-1h", "Hourly login attempts");
create_graph("login-day.gif", "-1d", "Daily login attempts");
create_graph("login-week.gif", "-1w", "Weekly login attempts");
create_graph("login-month.gif", "-1m", "Monthly login attempts");
create_graph("login-year.gif", "-1y", "Yearly login attempts");

echo "<table>";
echo "<tr><td>";
echo "<img src='login-day.gif' alt='Generated RRD image'>";
echo "</td><td>";
echo "<img src='login-week.gif' alt='Generated RRD image'>";
echo "</td></tr>";
echo "<tr><td>";
echo "<img src='login-month.gif' alt='Generated RRD image'>";
echo "</td><td>";
echo "<img src='login-year.gif' alt='Generated RRD image'>";
echo "</td></tr>";
echo "</table>";
exit;

function create_graph($output, $start, $title) {
  $options = array(
    "--slope-mode",
    "--start", $start,
    "--title=$title",
    "--vertical-label=User login attempts",
    "--lower=0",
    "DEF:success=login.rrd:success:AVERAGE",
    "DEF:failure=login.rrd:failure:AVERAGE",
    "CDEF:tsuccess=success,300,*",
    "CDEF:tfailure=failure,300,*",
    "AREA:tsuccess#00FF00:Successful attempts",
    "STACK:tfailure#FF0000:Failed attempts",
    "COMMENT:\\n",
    "GPRINT:tsuccess:AVERAGE:successful attempts %6.2lf",
    "COMMENT: ",
    "GPRINT:tfailure:AVERAGE:failure attempts %6.2lf",
  );

  $ret = rrd_graph($output, $options, count($options));
  if (! $ret) {
    echo "<b>Graph error: </b>".rrd_error()."\n";
  }
}

?>
Our result should be something like this:

Conclusion
RRDtool is a really great to generate graphs in a simple way, but don’t get fooled by it’s apparent simplicity. It’s capable of creating very complex graphs if needed. We just scraped the basics which is more than enough to get you started in your own graphs. Unfortunately, the PHP binding of RRDTool are not really well maintained, but since they are merely a shell around the command line version, they work properly enough to create cool graphs.
More information about RRD and the RRDTool can be found on the main RRD website: http://www.mrtg.org/rrdtool/index.en.html
Leave a comment
Use the form below to leave a comment:


Responses and Pingbacks
February 23rd, 2011 at 8:18 pm
[…] This post was mentioned on Twitter by Flint Web Dev News and Joshua Thijssen, Aurélien Olivier. Aurélien Olivier said: Creating RRD graphs in #PHP http://j.mp/gI9Tvk […]
February 28th, 2011 at 12:22 pm
rrd extennsion in main rrd tool repo is little bit outdated, refreshed extension code is part of pecl (a half of year maybe) – http://pecl.php.net/rrd, there is a few bugs, I think 1.0 will be available after month, also with the manual entries in php.net
September 27th, 2011 at 11:21 am
[…] RRD graphs in PHP >>> ได้ที่นี้ Share this:Like this:LikeBe the first to like this post. Leave a […]
November 4th, 2011 at 9:55 am
Where I can find php-rrdtool.dll for PHP 5.3.1 (xampp 1.7.7), or how to use the RRDtool in php using command lines?
URGENT
March 30th, 2012 at 12:23 pm
[…] the php|architect site today there’s a new tutorial from Joshua Thijssen about using RDD graphs in PHP. RDD graphs are commonly used in dashboard monitoring applications for everything from web […]
March 19th, 2013 at 8:18 am
This doesnt work anymore (all of the scripts):
rrd_update() expects parameter 2 to be array, string given in /var
May 1st, 2013 at 8:29 am
it works for me:
$opt= array(
“–imgformat”,”PNG”,
“–start”,”1367327334″,
“–end”,”1367413735″,
“–title”,”User/interest”,
“–base”,”1000″,
“–height”,”120″,
“–width”,”500″,
“–alt-autoscale-max”,
“–lower-limit”,”0″,
“–slope-mode”,
“–font”,”TITLE:10:”,
“–font”,”AXIS:7:”,
“–font”,”LEGEND:8:”,
“–font”,”UNIT:7:”,
“DEF:a=/var/www/html/cacti-0.8.8a/rra/iomsqwweb01_users_165.rrd:logged:AVERAGE”,
“DEF:b=/var/www/html/cacti-0.8.8a/rra/iomsqwapp01_total_230.rrd:total:AVERAGE”,
“LINE2:a#FF7D00FF:logged user” ,
“LINE2:b#00BF47FF:interests”
);
rrd_graph (“./user+int.png”,$opt,count($opt));
April 21st, 2015 at 8:55 am
please i need the help
somebody can help me to configure php5.5.23 whit php_rrdtools ?
when i have upgrade my php5.3 for php 5.5.23 the rrd module doesn’t exist
November 15th, 2017 at 4:13 am
The 3rd value is not more needed or allowed:
$ret = rrd_create(“login.rrd”, $options, count($options));
change to : $ret = rrd_create(“login.rrd”, $options);
the same at graph part.
On Update part:
$ret = rrd_update(“login.rrd”, array(“$t:$success:$failure”));